Clamp the bottom.
The entire bottom face is fixed in all three directions. The other faces can move. This is an ideal clamp on a 20 mm cube; it is not an unknown crystal or a scanned boulder.
DESTROYING BOULDERS / MATERIAL EDITION M01
The same shape. Three materials. A three-dimensional field of motion and stress, calculated from a volumetric elastic model.
Research direction: Ashley Kalkowski.
06 October 2026 · Numerical material comparison.
Physical tests: zero.
Current accuracy finding: the basic solver checks pass, while mesh and modal-adequacy screens fail. Inspect the failed checks before interpreting the animation
New: M02 resolution study. The follow-up refines the steel baseline and separates mesh, modal-cutoff and direct-reference differences. The original M01 fields and failed accuracy screens below remain unchanged. Read the refinement results
01 / A VOLUME, NOT A SINGLE COORDINATE
Each tetrahedral element occupies real volume. Every mesh node has three displacement components. The solver forms the full three-dimensional strain and stress tensors using a homogeneous, isotropic elastic law.
The entire bottom face is fixed in all three directions. The other faces can move. This is an ideal clamp on a 20 mm cube; it is not an unknown crystal or a scanned boulder.
A uniform downward pressure of 2,500 Pa acts on the top face, giving a 1 N peak harmonic resultant. That force is prescribed mathematically. No loudspeaker, horn, sticker or coupling path is modeled. The harmonic traction alternates sign; transmitting both push and pull would need a suitable physical interface.
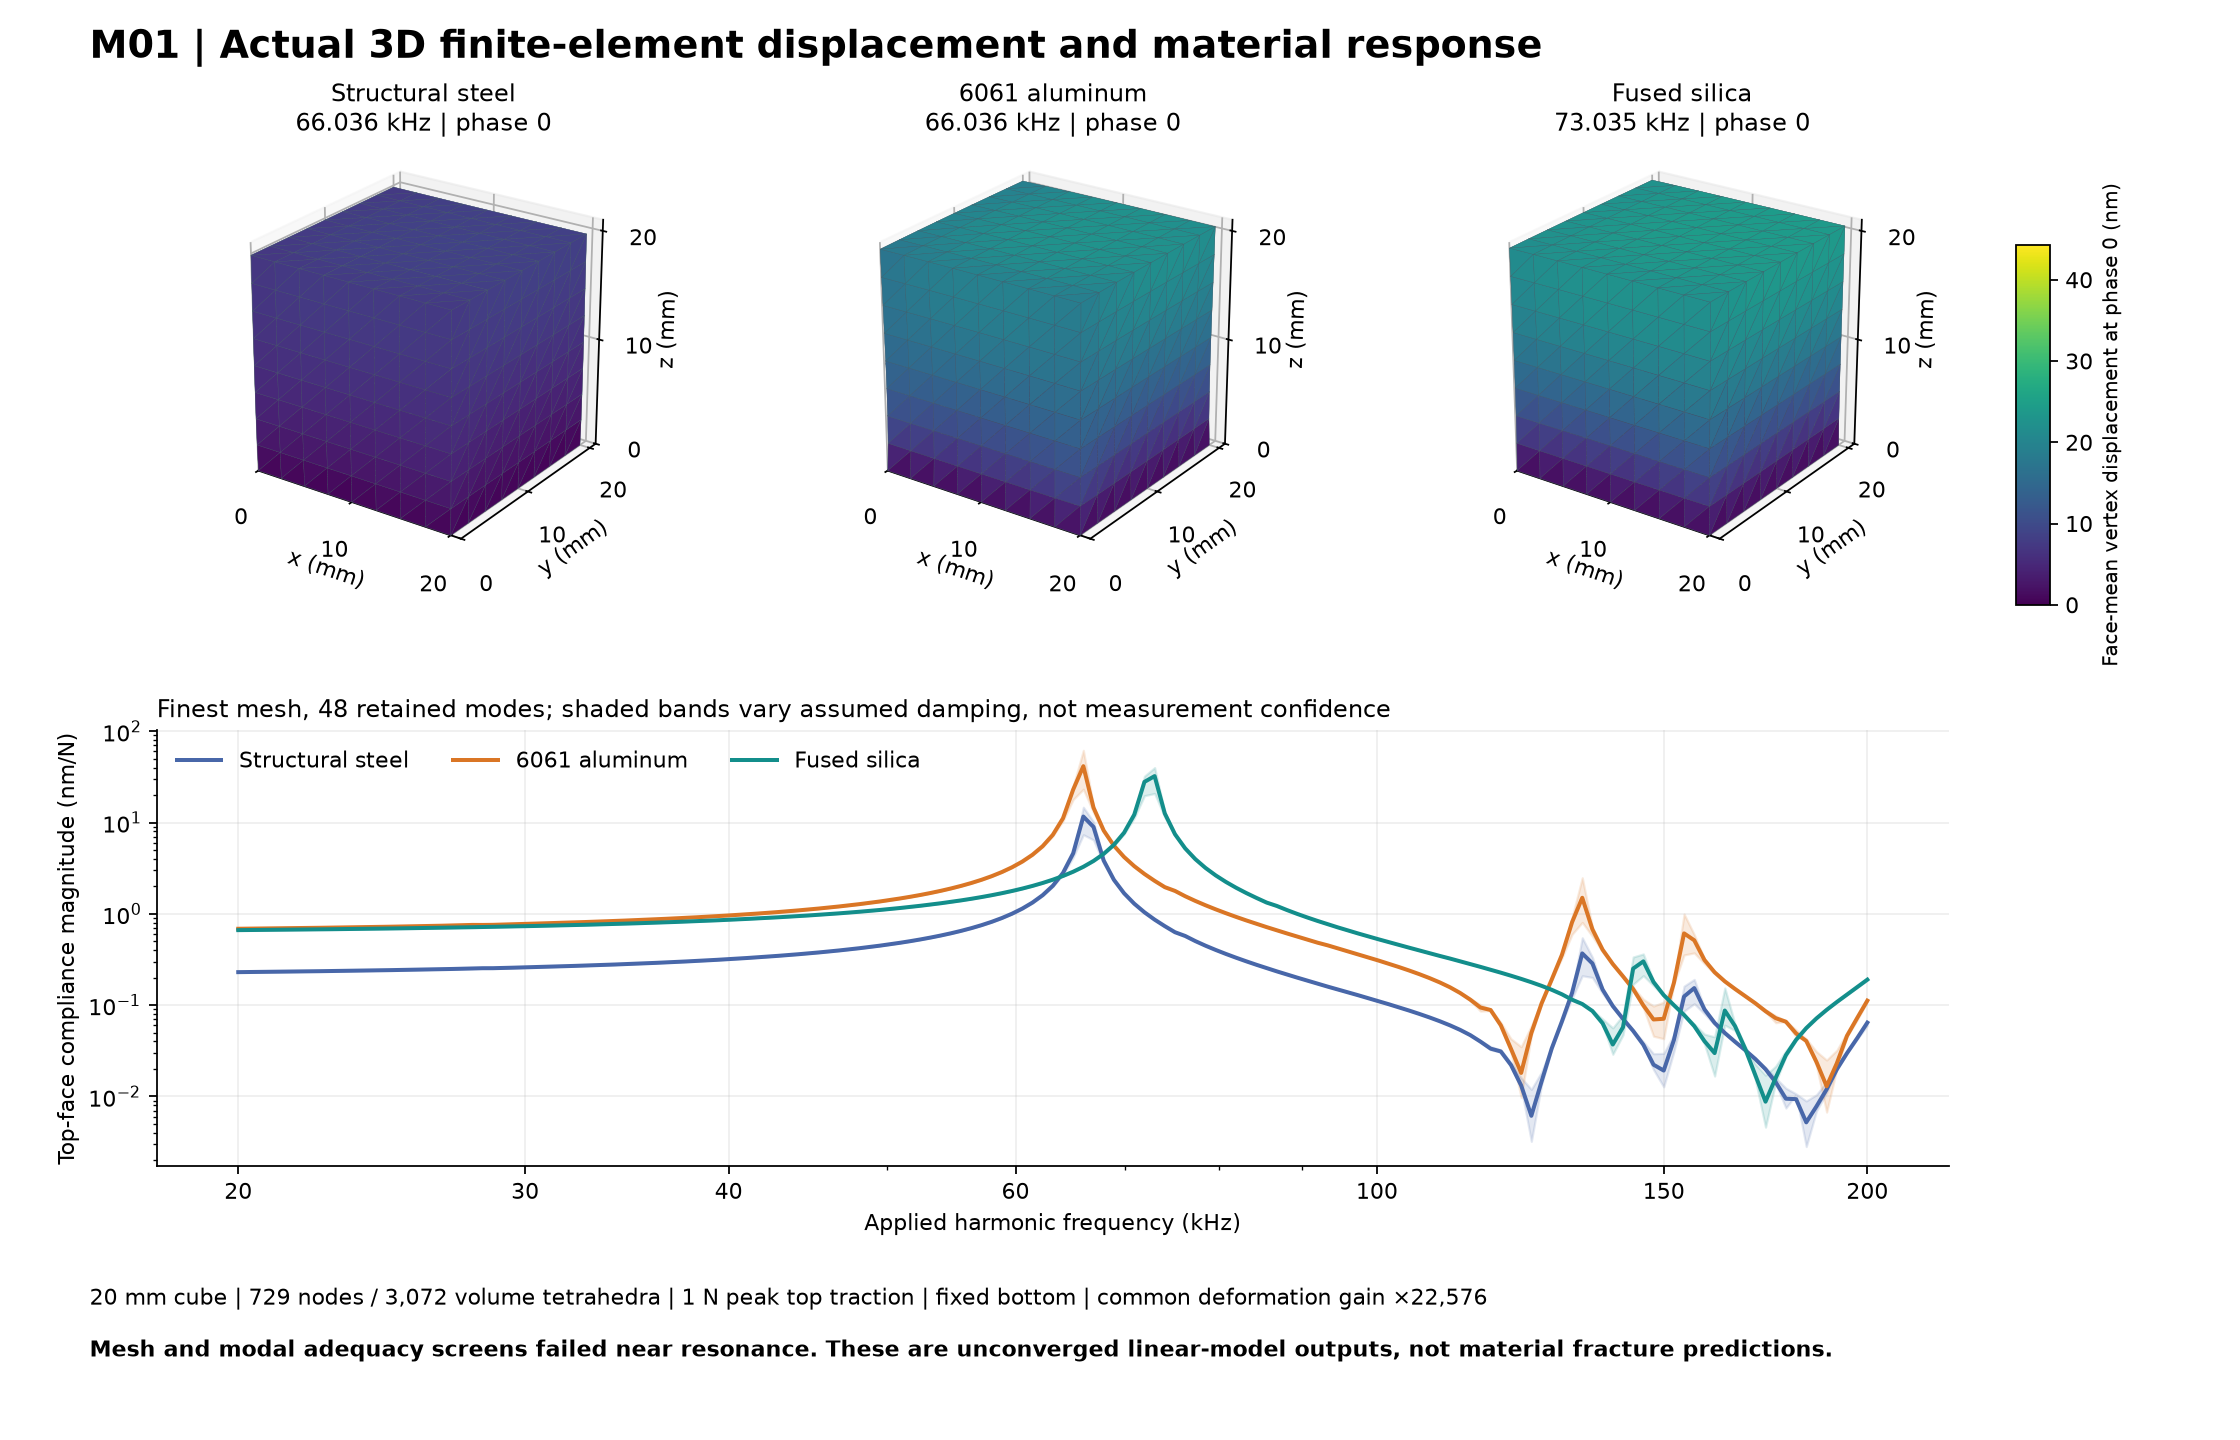
The frozen study uses 161 logarithmically spaced frequencies. Rayleigh damping is fitted to an assumed 1% at the band endpoints; it is not a measured material loss or a constant ratio at every frequency.
The frequency band belongs to this small, stiff, constrained specimen. It is 20,000–200,000 Hz. The E01 audio amplifier and speaker chain has not been shown to deliver this prescribed loading.
02 / INSPECT THE SAVED FIELD
The viewer reads stored complex FEM amplitudes. It reconstructs one sinusoidal cycle; it does not rerun the solver or simulate damage in your browser.
DISPLAY ONLY / NO SIGNAL OUTPUT
Drag or arrow keys: rotate.
Wheel: zoom. Phase is slowed.
Loading the saved volumetric fields…
The dashed outline is the undeformed cube. A common motion multiplier makes the largest saved nodal movement visible; the displayed multiplier is never a physical prediction. True scale uses ×1 and may appear almost still. Colors retain physical displacement or stress units and a common scale across the three materials.
Each material is shown at its own sampled maximum-compliance frequency on the 161-point grid, using the finest mesh and 48 retained modes. This is not an exact resonance search or a comparison at one common frequency. The full curves below retain the common frequency grid.
Stress comes from each linear tetrahedron’s constant displacement gradient. Von Mises stress describes the tensor field; it is not a brittle-fracture criterion. The clamp edge can create mesh-sensitive concentrations, and no crack, strength or toughness law is present.
Selected material’s manufacturer source · Saved viewer field data
03 / ACCURACY IS A SEPARATE RESULT
The plan froze numerical validity checks separately from mesh and modal-adequacy screens. A successful matrix solve can still give an insufficiently resolved response.
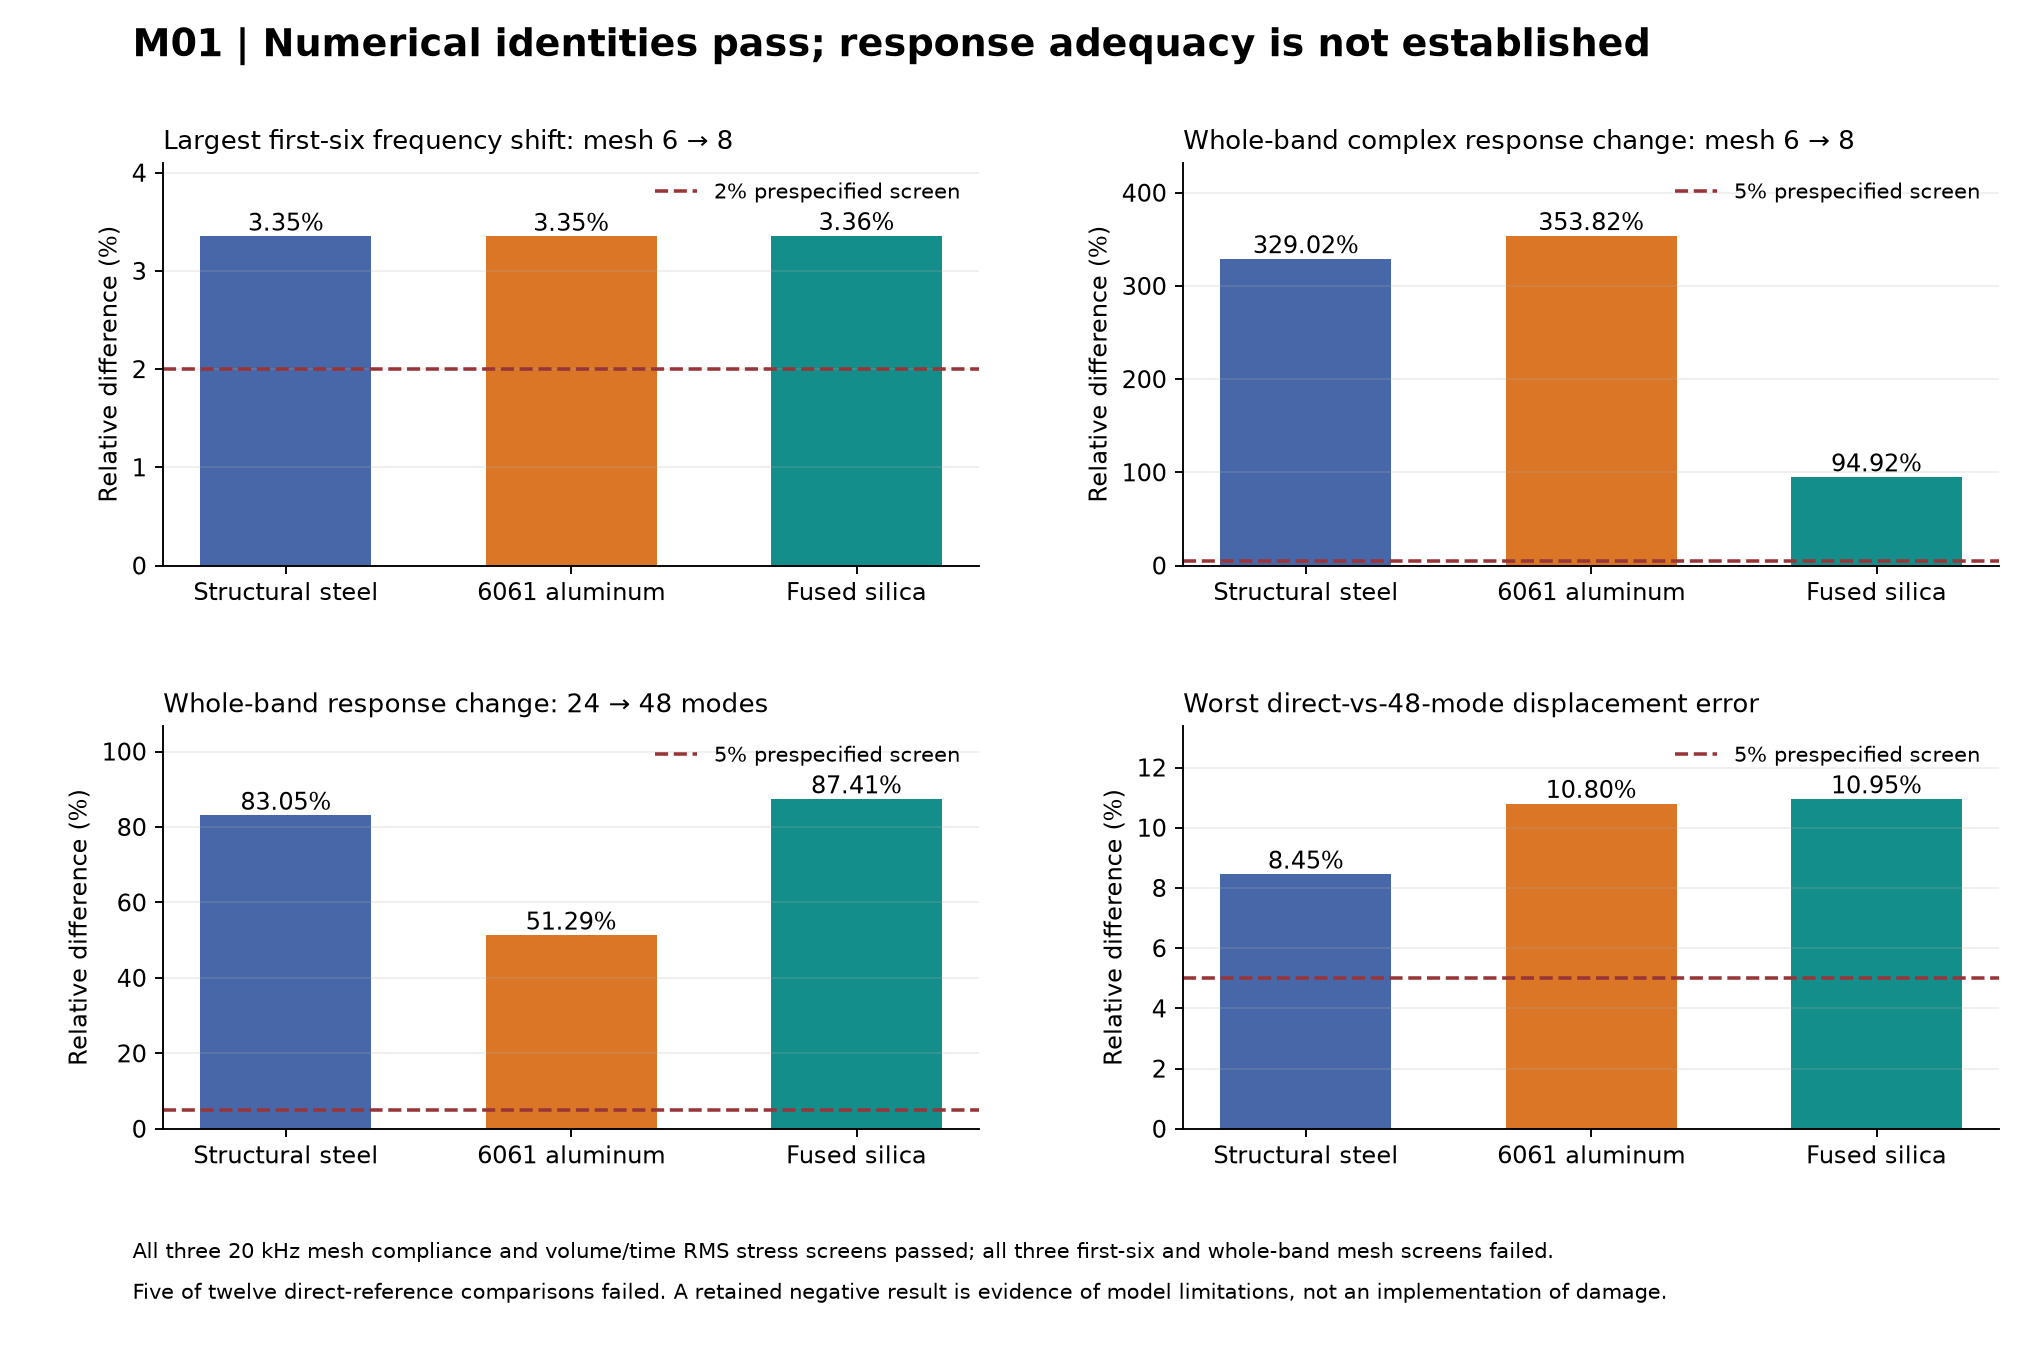
The current full-band response is not sufficiently resolved. All basic numerical checks pass, but every material fails the finest-pair spectrum screen and the whole-band compliance screen. All 12 modal-truncation screens fail, and 5 of 12 direct-reference comparisons exceed their 5% criterion. These failures remain in the evidence; the fields are not a precision prediction or a fracture result.
| Material | Largest first-six frequency shift 2% screen | Whole-band normalized complex compliance difference 5% screen | 20 kHz compliance 5% screen | 20 kHz volume/time RMS stress 5% screen |
|---|---|---|---|---|
| Structural steel | 3.352% · fail | 329.0% · fail | 0.008% · pass | 0.447% · pass |
| 6061 aluminum | 3.350% · fail | 353.8% · fail | 0.110% · pass | 0.683% · pass |
| Fused silica | 3.358% · fail | 94.9% · fail | 0.288% · pass | 0.080% · pass |
The whole-band metric compares complex response point by point with a denominator floor equal to 1% of the reference peak. Values over 100% are that frozen normalized difference; they are not a confidence interval or a percentage error at every frequency. Passing the two 20 kHz screens does not establish accuracy across the band.
Fifteen author unit and analytical benchmark tests passed. Mass and force conservation, rigid-body behavior, constrained displacement, eigenpair residuals, orthogonality and energy/power checks also passed. The current execution retained 12 material/mesh eigensolutions, 18 response curves and 12 direct complex solves. No new time-domain ODE integrations or physical trials were performed.
Direct-versus-48-mode checks pass at all three selected display frequencies: about 66.036 kHz for steel and aluminum, and 73.035 kHz for fused silica. That does not erase mesh sensitivity or the other direct-reference failures. The worst direct mass-norm discrepancy is 10.953%.
Two, four, six and eight subdivisions per axis produce 48, 384, 1,296 and 3,072 tetrahedra. The frozen acceptance screens compare the finest pair; extra pixels in the viewer do not refine the calculation.
The response approximation is tested for sensitivity to retained-mode count. Direct complex solves at selected frequencies provide an additional comparison, including the displayed grid peak.
The finest-mesh curves also use 0.5% and 2% endpoint damping anchors. These are controlled alternatives to the 1% baseline, not catalog measurements or fitted specimen data.
04 / WHAT CHANGES BETWEEN MATERIALS
The model uses Young’s modulus, density and Poisson’s ratio. Hardness, strength and fracture toughness answer different questions and are not substituted for those elastic inputs.
ArcelorMittal’s generic structural coefficients. No specific certified grade, heat or elastic-property temperature is identified by that table. Rolling texture, welds and residual stress are not represented.
Manufacturer sourceNominal T6 identification, with Hydro’s approximate common 6xxx elastic values and tabulated 6061 density. These are rounded isotropic inputs, not a measured extrusion direction or heat certificate.
Manufacturer sourceCorning’s HPFS property table specifies 25°C. Fused silica is amorphous glass. It does not represent an oriented quartz crystal, diamond or a heterogeneous piece of natural rock.
Manufacturer sourceIndentation hardness depends on the test method and material response. Elastic modulus characterizes reversible stiffness. Neither alone supplies a fracture threshold, and a hardness score cannot determine a specimen’s resonance.
A fracture calculation needs an appropriate toughness or damage law plus flaws, geometry, loading and boundary evidence. Crystal orientation, grain structure and temperature may matter. This edition does not infer them from a material name.
NIST: distinct mechanical properties and indentation limits · NIST: fracture-toughness data and definitions
05 / OPEN THE COMPUTATIONAL RECORD
The video is a rendering of calculated phases. Its frame map and receipt connect images to saved model data. It is not footage of a tested device or a breaking specimen.
Each NPZ contains the retained volume data for one material. The web viewer uses rounded display vectors; use the volume files and core source for numerical inspection.
The core source archive contains the frozen plan, material inputs, solver, tests and saved results. The earlier serialization failure is preserved separately; it is not counted as additional independent numerical evidence. Physical trials: zero. No patented status, hardware efficiency or fracture performance follows from this calculation.
Independent numerical reconstruction within this project passed 227 checks; it does not turn failed adequacy screens into passes. The recorded video passed a separate 32-check frame/data audit. Numerical audit · Video audit · Independent source inventory
Core ZIP: 380,695 bytes · SHA-256 239785e32ac8916075054da918701f51b0387b542dd2bd7c0fcb12b7aa0fb30a. Both vector figures are inside the archive; the displayed fields, two PNG figures and three full-precision volume files are separate downloads. Complete source/evidence manifest · Complete execution summary · Material-property scope.
Video delivery revision: the current smaller encoding passed the same 32 checks, with all retained source frames and the frame map unchanged. An intermediate encoding failed one image-integrity check and was rejected. Encoding-only change receipt · Preserved rejected encoding check. The original reviewer inventory preserves the earlier encoding audit.
The small-strain isotropic stress law and variational form are referenced to The equations of linear elasticity, whose chapter credits Anders Logg and Hans Petter Langtangen, in the current FEniCSx tutorial by Jørgen S. Dokken. The current tutorial is an adaptation under CC BY 4.0. This is a formulation reference, not external validation of our implementation.
Record geometry, mass, composition, temperature and support conditions. For crystals, identify orientation and a suitable anisotropic tensor before treating this as a specimen-specific prediction.
Refine the mesh and retained-mode approximation against the frozen failed screens. Test boundary and damping sensitivity, then compare response with measured data.
Model and measure the actuator, attachment or acoustic transmission. A prescribed force on a surface is not evidence that the proposed electronics can create it.